PRT Scanner (Particle Analyzer)
- The Krakatoa PRT Scanner (a.k.a. Particle Analyzer) Utility is a scripted tool accompanying Krakatoa.
- It provides means to
- gather data about particle counts and memory usage,
- detect missing and corrupted particle files and
- output useful information in various forms incl. dynamic rollouts, HTML Pages and Text files.
Supported Particle Sources
- The Particle Scanner can supports the following particle sources:
- PRT Files incl. particle count, file existence and file corruption.
- BIN and CSV Files will be checked for existence only. (Support for particle count to be added later).
- Particle Flows
- 3ds Max Legacy Particles
- Geometry Vertices
Output Options
- By default, the Scanner will output the results as graphics in a set of 3ds Max Rollouts
- Optionally, the Scanner can output the results to an HTML report which will be stored on disk for future reference.
- In addition, a text file containing the paths of all missing particle files can be generated.
- The graphs can display either the disk particle counts or the actual particle counts after taking into account the timing and render percentage settings.
- The Scanner can display information about each file sequence in every PRT Loader, about the aggregate count in the PRT Loader and the whole scene, or the aggregate and scene results only.
- The Scanner can show the minimum, maximum and average counts and the frames the min. and max. are reached. (This option is on by default)
- The Scanner can display a memory reference line representing the particle count necessary to reach that memory load during rendering.
User Interface
- >Scan Geometry Vertices - Unchecked by default. When checked, geometry objects will be assumed particle sources and their vertex count on each frame of the current animation segment will be included in the scan.
- >Scan Particle Flow System - Unchecked by default. When checked, Particle Flows will be included in the scan. This requires the scan through the current animation segment. The render particle count is extrapolated using the viewport particle count and the Viewport percentage. If Viewport percent is set to 0, the render count will be incorrectly assumed as 0, too.
- >Scan Max Legacy Particle Systems - Unchecked by default. When checked, 3ds Max legacy particle systems will be included in the scan. This requires the scan through the current animation segment. When the system supports separate count for viewport and renderer, the render particle count will be extrapolated using the viewport particle count and the Viewport percentage. If Viewport percent is set to 0, the render count will be incorrectly assumed as 0, too.
- >Include Details On Each PRT Sequence - When checked (default), details about each particle sequence in every Particle Loader will be included in the report. When unchecked, only the Particle Loader’s total (green graph by default) will be included.
- Fit Vertical Scale To Max Particle Count / Use Custom Vertical Scale drop-down list.
- Fit Vertical Scale To Max Particle Count - the vertical scale will be adjusted so that the highest particle count for each graph reaches the top of the image.
- Use Custom Vertical Scale - the vertical scale will be defined by the user via the “Custom Vertical Scale (x1000)” spinner. This ensures that all graphs will have the same scale, but some particle systems might have too few particles to display visible color bars, or too many particles to fit in the image and would be clipped.
- >Respect Loader’s Render Percentage - when checked (default), the particle count displayed will reflect the actual render count. When unchecked, the scan will use the absolute disk particle count (useful when inspecting the content of particle files as opposed to what will be rendered).
- >Respect Loader’s Timing Settings - when checked (default), the particle timing options like Offset, Playback Graph and Load Range will be taken into account. When unchecked, the actual frame numbers of files would be reflected in the horizontal axis of the graph.
- Show Memory Reference Line (MB) - this value defines the location of the memory reference line in the graph. When using the graph display in the Analyzer’s Floater, changing this value will update the SCENE TOTALS display dynamically, moving a red line according to the entered value.
- >Include Text Labels In Internal Reports - when checked (default), the report in the Analyzer Floater will include text details about Frame Range, Min., Max. and Average counts etc.
- Scanner Graph Height In Pixels - this value defines the height of each graph bitmap in pixels used for the internal display. The width is fixed, based on the floater’s width.
- HTML Graph Width In Pixels - this value defines the width of the HTML graph bitmaps in pixels. Default is 1000, range is from 500 to 2000.
- HTML Graph Height In Pixels - this value defines the height of the HTML graph bitmaps in pixels. Default is 200, range is 50 to 500.
- Minor Line Every N Frames - this value defines the number of frames to draw a minor line at in the background of the graph.
- Major Line Every N Frames - this value defines the number of minor lines to draw a major line at in the background of the graph.
- The Graph Colors group of control provides access to the drawing colors of the graph bitmaps. (NOTE: These colors are NOT stored between sessions yet and will be reset to defaults next time you start the Utility!).
- Whole Scene / Selected Objects - the Scanner can process either all objects of specified types in the scene or only the selected particle sources.
- >HTML Report - Unchecked by default. When checked, the report will be written to an HTML file and both the file and the bitmaps will be stored on disk for future reference. In addition, the size of the bitmaps can be set to much larger values in the HTML version, allowing for better precision when scanning very long sequences with thousands of frames. The report will be saved in a folder PRTscan inside the Krakatoa settings folder (press “Explore Folder” in the Krakatoa GUI > Presets and History to easily navigate to the results).
- >Missing Files Report - Unchecked by default. When checked, a text file will be written in the PRTscanBadFiles folder inside the Krakatoa settings folder and will be opened in Notepad. It will contain the file names of all missing files. The file name will contain the MAX scene file name and the current date and time.
- ANALYZE SCENE… - this button launches the scan process. Depending on the number of files to scan, the number and type of objects to process and the location of files (local vs. network), this process can take between a couple of seconds and several minutes. Two progress bars will show the progress of the current object and the total progress.
Colors And Their Meaning
General Rules
All colors will be shown in iterating shades defined by colors 1 and 2, thus making it possible to see the even and odd frames in different colors. When “Respect Loader’s Render Percentage” is checked, the render count will be represented in the defined graph colors, while the actual particle count on disk will be shown in a brighter shade of the same color (see HTML Report further on this page for an example)
Good Frames
Files in a single sequence that have returned a valid count will be displayed in the “Normal” colors (default: blue) If all file sequences in a Particle Loader have returned a valid count, the frame will be displayed using the “Loader” colors (default:green) If all particle sources in the Scene have returned a valid count, the frame will be displayed using the “Scene” colors (default: orange)
Bad Frames
If a file in a single sequence could not be found, it will be displayed in a gradient of the Missing color (default:red) going from opaque at the bottom to transparent at the top. Such a frame would fail the renderer. If a Particle Loader has all its file sequences return “file not found”, the frame will also be displayed in a gradient of the Missing color (default:red) going from opaque at the bottom to transparent at the top. Such a frame would fail the renderer. If the Scene has found only missing files on a frame, it will also be displayed as described above. Such a frame will fail the renderer. If there is at least one missing frame among multiple sequences in a Particle Loader or Scene, the frame will be displayed in the Missing color (default:red) but without the gradient - it will use the actual count of the frames that were valid. Such a frame will fail the renderer.
Unknown Counts
Some particle files (currently only CSV) do not have a header with a particle count, so the count cannot be detected easily. Such frames will return a valid but unknown count and will be displayed in the Normal color but with an opacity gradient like in missing frames. This shows that while we don’t know the exact count and cannot represent it as a color bar, there IS a valid number of particles and the frame will not fail the renderer. If one or more of the file sequences in a Particle Loader use CSV and the other sequences have valid counts, only the known particle counts will be displayed for the PRT LOADER TOTALS and SCENE TOTALS graphs.
HTML Report Output
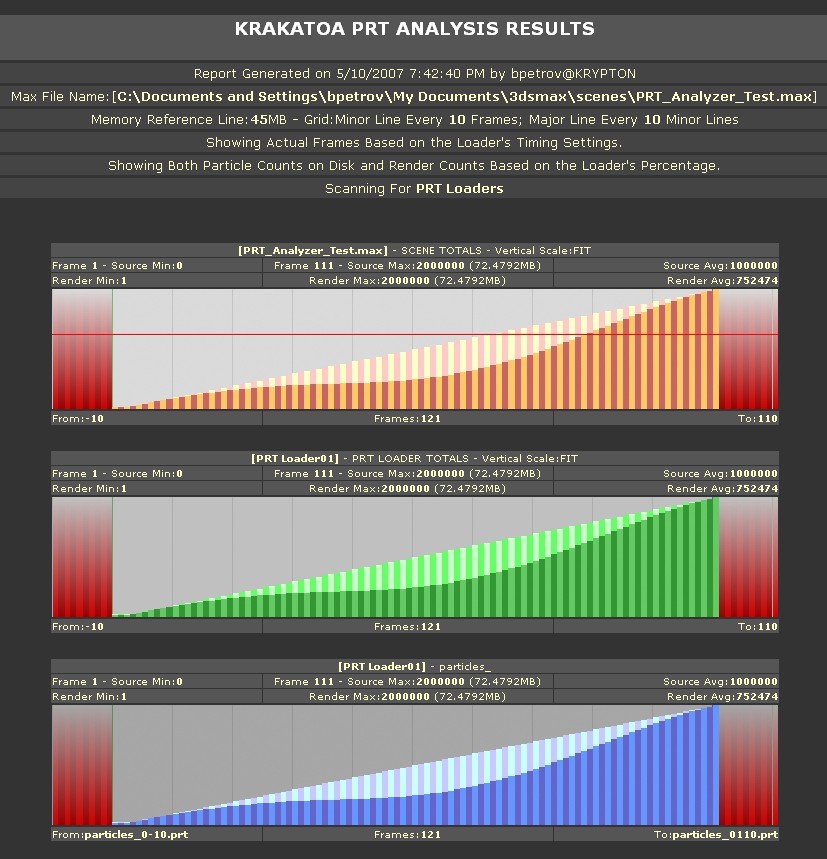
- Note that the graph displays two sets of particle counts - the darker colors are the actual requested particle counts for rendering (in this case, the Render Percentage value was keyframed over time).
- The brighter colors display the actual counts in the particle files